Automatically Discover Missing Physics by Embedding Machine Learning into Differential Equations
One of the most time-consuming parts of modeling is building the model. How do you know when your model is correct? When you solve an inverse problem to calibrate your model to data, who you gonna call if there are no parameters that make the model the data? This is the problem that the Universal Differential Equation (UDE) approach solves: the ability to start from the model you have, and suggest minimal mechanistic extensions that would allow the model to fit the data. In this showcase, we will show how to take a partially correct model and auto-complete it to find the missing physics.
For a scientific background on the universal differential equation approach, check out Universal Differential Equations for Scientific Machine Learning
Starting Point: The Packages To Use
There are many packages which are used as part of this showcase. Let's detail what they are and how they are used. For the neural network training:
| Module | Description |
|---|---|
| OrdinaryDiffEq.jl (DifferentialEquations.jl) | The numerical differential equation solvers |
| SciMLSensitivity.jl | The adjoint methods, defines gradients of ODE solvers |
| Optimization.jl | The optimization library |
| OptimizationOptimisers.jl | The optimization solver package with Adam |
| OptimizationOptimJL.jl | The optimization solver package with LBFGS |
| LineSearches.jl | Line search algorithms package to be used with LBFGS |
| ComponentArrays.jl | For the ComponentArray type to match Lux to SciML |
For the symbolic model discovery:
| Module | Description |
|---|---|
| ModelingToolkit.jl | The symbolic modeling environment |
| DataDrivenDiffEq.jl | The symbolic regression interface |
| DataDrivenSparse.jl | The sparse regression symbolic regression solvers |
| Zygote.jl | The automatic differentiation library for fast gradients |
Julia standard libraries:
| Module | Description |
|---|---|
| LinearAlgebra | Required for the norm function |
| Statistics | Required for the mean function |
And external libraries:
| Module | Description |
|---|---|
| Lux.jl | The deep learning (neural network) framework |
| Plots.jl | The plotting and visualization library |
| StableRNGs.jl | Stable random seeding |
The deep learning framework Flux.jl could be used in place of Lux, though most tutorials in SciML generally prefer Lux.jl due to its explicit parameter interface, leading to nicer code. Both share the same internal implementations of core kernels, and thus have very similar feature support and performance.
# SciML Tools
import OrdinaryDiffEq as ODE
import ModelingToolkit as MTK
import DataDrivenDiffEq
import SciMLSensitivity as SMS
import DataDrivenSparse: ADMM
import Optimization as OPT
import OptimizationOptimisers: Adam
import OptimizationOptimJL: BFGS, LBFGS
import LineSearches: BackTracking

# Standard Libraries
import LinearAlgebra
import Statistics

# External Libraries
import ComponentArrays
import Lux
import Zygote
import Plots
import StableRNGs
Plots.gr()

# Set a random seed for reproducible behaviour
rng = StableRNGs.StableRNG(1111)StableRNGs.LehmerRNG(state=0x000000000000000000000000000008af)Problem Setup
In order to know that we have automatically discovered the correct model, we will use generated data from a known model. This model will be the Lotka-Volterra equations. These equations are given by:
\[\begin{aligned} \frac{dx}{dt} &= \alpha x - \beta x y \\ \frac{dy}{dt} &= -\delta y + \gamma x y \\ \end{aligned}\]
This is a model of rabbits and wolves. $\alpha x$ is the exponential growth of rabbits in isolation, $-\beta x y$ and $\gamma x y$ are the interaction effects of wolves eating rabbits, and $-\delta y$ is the term for how wolves die hungry in isolation.
Now assume that we have never seen rabbits and wolves in the same room. We only know the two effects $\alpha x$ and $-\delta y$. Can we use Scientific Machine Learning to automatically discover an extension to what we already know? That is what we will solve with the universal differential equation.
Generating the Training Data
First, let's generate training data from the Lotka-Volterra equations. This is straightforward and standard DifferentialEquations.jl usage. Our sample data is thus generated as follows:
function lotka!(du, u, p, t)
    α, β, γ, δ = p
    du[1] = α * u[1] - β * u[2] * u[1]
    du[2] = γ * u[1] * u[2] - δ * u[2]
    return
end

# Define the experimental parameter
tspan = (0.0, 5.0)
u0 = 5.0f0 * rand(rng, 2)
p_ = [1.3, 0.9, 0.8, 1.8]
prob = ODE.ODEProblem(lotka!, u0, tspan, p_)
solution = ODE.solve(prob, ODE.Vern7(), abstol = 1.0e-12, reltol = 1.0e-12, saveat = 0.25)

# Add noise in terms of the mean
X = Array(solution)
t = solution.t

x̄ = Statistics.mean(X, dims = 2)
noise_magnitude = 5.0e-3
Xₙ = X .+ (noise_magnitude * x̄) .* randn(rng, eltype(X), size(X))

Plots.Plots.plot(solution, alpha = 0.75, color = :black, label = ["True Data" nothing])
Plots.scatter!(t, transpose(Xₙ), color = :red, label = ["Noisy Data" nothing])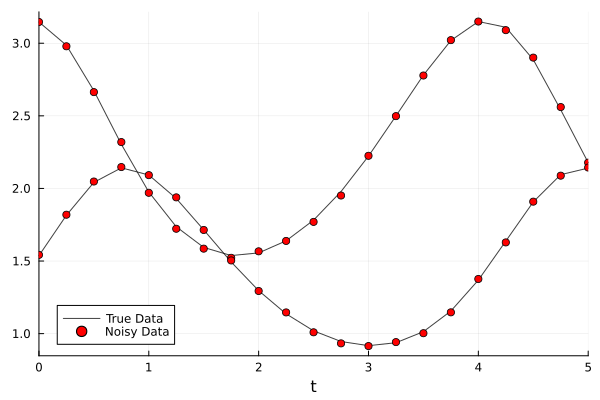
Definition of the Universal Differential Equation
Now let's define our UDE. We will use Lux.jl to define the neural network as follows:
rbf(x) = exp.(-(x .^ 2))

# Multilayer FeedForward
const U = Lux.Chain(
    Lux.Dense(2, 5, rbf), Lux.Dense(5, 5, rbf), Lux.Dense(5, 5, rbf),
    Lux.Dense(5, 2)
)
# Get the initial parameters and state variables of the model
p, st = Lux.setup(rng, U)
const _st = st
(layer_1 = NamedTuple(), layer_2 = NamedTuple(), layer_3 = NamedTuple(), layer_4 = NamedTuple())We then define the UDE as a dynamical system that is u' = known(u) + NN(u) like:
# Define the hybrid model
function ude_dynamics!(du, u, p, t, p_true)
    û = U(u, p, _st)[1] # Network prediction
    du[1] = p_true[1] * u[1] + û[1]
    du[2] = -p_true[4] * u[2] + û[2]
    return
end

# Closure with the known parameter
nn_dynamics!(du, u, p, t) = ude_dynamics!(du, u, p, t, p_)
# Define the problem
prob_nn = ODE.ODEProblem(nn_dynamics!, Xₙ[:, 1], tspan, p)
ODEProblem with uType Vector{Float64} and tType Float64. In-place: true
Non-trivial mass matrix: false
timespan: (0.0, 5.0)
u0: 2-element Vector{Float64}:
3.1463924566781167
1.5423300037202512Notice that the most important part of this is that the neural network does not have hard-coded weights. The weights of the neural network are the parameters of the ODE system. This means that if we change the parameters of the ODE system, then we will have updated the internal neural networks to new weights. Keep that in mind for the next part.
... and tada: now we have a neural network integrated into our dynamical system!
Even if the known physics is only approximate or correct, it can be helpful to improve the fitting process! Check out this JuliaCon talk which dives into this issue.
Setting Up the Training Loop
Now let's build a training loop around our UDE. First, let's make a function predict which runs our simulation at new neural network weights. Recall that the weights of the neural network are the parameters of the ODE, so what we need to do in predict is update our ODE to our new parameters and then run it.
For this update step, we will use the remake function from the SciMLProblem interface. remake works by specifying key = value pairs to update in the problem fields. Thus to update u0, we would add a keyword argument u0 = .... To update the parameters, we'd do p = .... The field names can be acquired from the problem documentation (or the docstrings!).
Knowing this, our predict function looks like:
function predict(θ, X = Xₙ[:, 1], T = t)
    _prob = ODE.remake(prob_nn, u0 = X, tspan = (T[1], T[end]), p = θ)
    return Array(
        ODE.solve(
            _prob, ODE.Vern7(), saveat = T,
            abstol = 1.0e-6, reltol = 1.0e-6,
            sensealg = SMS.QuadratureAdjoint(autojacvec = SMS.ReverseDiffVJP(true))
        )
    )
end
predict (generic function with 3 methods)There are many choices for the combination of sensitivity algorithm and automatic differentiation library (see Choosing a Sensitivity Algorithm. For example, you could have used sensealg=ForwardDiffSensitivity().
Now, for our loss function, we solve the ODE at our new parameters and check its L2 loss against the dataset. Using our predict function, this looks like:
function loss(θ)
    X̂ = predict(θ)
    return Statistics.mean(abs2, Xₙ .- X̂)
end
loss (generic function with 1 method)Lastly, what we will need to track our optimization is to define a callback as defined by the OptimizationProblem's solve interface. Because our function only returns one value, the loss l, the callback will be a function of the current parameters θ and l. Let's setup a callback prints every 50 steps the current loss:
losses = Float64[]

callback = function (state, l)
    push!(losses, l)
    if length(losses) % 50 == 0
        println("Current loss after $(length(losses)) iterations: $(losses[end])")
    end
    return false
end
#1 (generic function with 1 method)Training
Now we're ready to train! To run the training process, we will need to build an OptimizationProblem. Because we have a lot of parameters, we will use Zygote.jl. Optimization.jl makes the choice of automatic differentiation easy, just by specifying an adtype in the OptimizationFunction construction
Knowing this, we can build our OptimizationProblem as follows:
adtype = OPT.AutoZygote()
optf = OPT.OptimizationFunction((x, p) -> loss(x), adtype)
optprob = OPT.OptimizationProblem(optf, ComponentArrays.ComponentVector{Float64}(p))OptimizationProblem. In-place: true
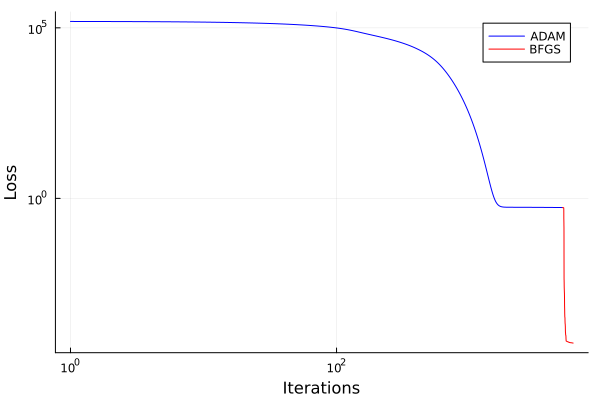
u0: ComponentVector{Float64}(layer_1 = (weight = [0.6538559794425964 0.7530555129051208; 0.5314245820045471 -1.146309733390808; … ; 0.6230413317680359 -0.9949618577957153; -0.267433762550354 -0.42296043038368225], bias = [0.6228184700012207, -0.36390432715415955, 0.5564076900482178, -0.6573317050933838, 0.0013557798229157925]), layer_2 = (weight = [-0.6952740550041199 -0.17967918515205383 … 0.24313241243362427 0.0011237671133130789; -0.17176461219787598 -0.6643869876861572 … 0.18968746066093445 0.04383227229118347; … ; -0.6787673234939575 -0.4131874740123749 … 0.1658746749162674 -0.5179172158241272; -0.10373303294181824 -0.49185651540756226 … -0.043933477252721786 -0.2150842249393463], bias = [0.0037434629630297422, -0.18621833622455597, -0.20786269009113312, -0.3489077389240265, 0.14812849462032318]), layer_3 = (weight = [-0.5676549077033997 0.2754976451396942 … 0.597773551940918 -0.04514681175351143; 0.7638720273971558 0.09472294896841049 … -0.47445687651634216 -0.6932666301727295; … ; -0.03054356575012207 -0.18625909090042114 … -0.33154675364494324 0.035615935921669006; 0.5577947497367859 0.5849692821502686 … 0.20916324853897095 0.7067036032676697], bias = [-0.25027230381965637, 0.0903530940413475, 0.41296181082725525, 0.19502975046634674, -0.20660826563835144]), layer_4 = (weight = [0.22668682038784027 0.28912562131881714 … -0.4954346716403961 -0.13401342928409576; 0.6387283802032471 0.011346816085278988 … 0.20840884745121002 -0.3841484785079956], bias = [-0.30624446272850037, 0.07177023589611053]))Now... we optimize it. We will use a mixed strategy. First, let's do some iterations of ADAM because it's better at finding a good general area of parameter space, but then we will move to BFGS which will quickly hone in on a local minimum. Note that if we only use ADAM it will take a ton of iterations, and if we only use BFGS we normally end up in a bad local minimum, so this combination tends to be a good one for UDEs.
Thus we first solve the optimization problem with ADAM. Choosing a learning rate of 0.1 (tuned to be as high as possible that doesn't tend to make the loss shoot up), we see:
res1 = OPT.solve(optprob, Adam(); callback, maxiters = 5000)
println("Training loss after $(length(losses)) iterations: $(losses[end])")
┌ Warning: Lux.apply(m::AbstractLuxLayer, x::AbstractArray{<:ReverseDiff.TrackedReal}, ps, st) input was corrected to Lux.apply(m::AbstractLuxLayer, x::ReverseDiff.TrackedArray}, ps, st).
│
│ 1. If this was not the desired behavior overload the dispatch on `m`.
│
│ 2. This might have performance implications. Check which layer was causing this problem using `Lux.Experimental.@debug_mode`.
└ @ ArrayInterfaceReverseDiffExt ~/.julia/packages/LuxCore/kQC9S/ext/ArrayInterfaceReverseDiffExt.jl:9
Current loss after 50 iterations: 124231.93947253245
Current loss after 100 iterations: 99525.79122504535
Current loss after 150 iterations: 73986.9930731763
Current loss after 200 iterations: 57253.855277932125
Current loss after 250 iterations: 46433.63757404681
Current loss after 300 iterations: 37891.222961763604
Current loss after 350 iterations: 30743.914129099703
Current loss after 400 iterations: 24605.350888305293
Current loss after 450 iterations: 19422.92043553857
Current loss after 500 iterations: 14986.693879907629
Current loss after 550 iterations: 11212.357475233737
Current loss after 600 iterations: 8098.753432720412
Current loss after 650 iterations: 5665.968969123539
Current loss after 700 iterations: 3872.1477982929873
Current loss after 750 iterations: 2601.361849724131
Current loss after 800 iterations: 1721.9533356446746
Current loss after 850 iterations: 1122.8663468291354
Current loss after 900 iterations: 720.5491377365902
Current loss after 950 iterations: 454.5184815415797
Current loss after 1000 iterations: 281.58421640777135
Current loss after 1050 iterations: 171.22536632048028
Current loss after 1100 iterations: 102.16452240317159
Current loss after 1150 iterations: 59.821864785183955
Current loss after 1200 iterations: 34.40377901448921
Current loss after 1250 iterations: 19.473604782538484
Current loss after 1300 iterations: 10.897063911971038
Current loss after 1350 iterations: 6.081246258141074
Current loss after 1400 iterations: 3.4392043920521176
Current loss after 1450 iterations: 2.0237190777595635
Current loss after 1500 iterations: 1.2836008251582223
Current loss after 1550 iterations: 0.9062386095314364
Current loss after 1600 iterations: 0.7193556611916404
Current loss after 1650 iterations: 0.628532609132601
Current loss after 1700 iterations: 0.5853885038467773
Current loss after 1750 iterations: 0.565429077783462
Current loss after 1800 iterations: 0.5564062505803624
Current loss after 1850 iterations: 0.5523966264451194
Current loss after 1900 iterations: 0.5506224111493262
Current loss after 1950 iterations: 0.5498169377104022
Current loss after 2000 iterations: 0.5494185520628245
Current loss after 2050 iterations: 0.5491853237251385
Current loss after 2100 iterations: 0.5490161393126846
Current loss after 2150 iterations: 0.5488700454063677
Current loss after 2200 iterations: 0.5487309892263287
Current loss after 2250 iterations: 0.5485928923832939
Current loss after 2300 iterations: 0.5484535394054524
Current loss after 2350 iterations: 0.548312160242271
Current loss after 2400 iterations: 0.548168507423681
Current loss after 2450 iterations: 0.5480225164949433
Current loss after 2500 iterations: 0.5478741857451604
Current loss after 2550 iterations: 0.5477235352813665
Current loss after 2600 iterations: 0.5475705936994653
Current loss after 2650 iterations: 0.5474153939693773
Current loss after 2700 iterations: 0.5472579722684878
Current loss after 2750 iterations: 0.547098367716522
Current loss after 2800 iterations: 0.5469366223719638
Current loss after 2850 iterations: 0.5467727812988166
Current loss after 2900 iterations: 0.5466068926491479
Current loss after 2950 iterations: 0.5464390077464257
Current loss after 3000 iterations: 0.5462691811655455
Current loss after 3050 iterations: 0.5460974708082494
Current loss after 3100 iterations: 0.5459239379732486
Current loss after 3150 iterations: 0.5457486474205309
Current loss after 3200 iterations: 0.545571667429279
Current loss after 3250 iterations: 0.545393069848851
Current loss after 3300 iterations: 0.5452129301422151
Current loss after 3350 iterations: 0.5450313274212167
Current loss after 3400 iterations: 0.5448483444730675
Current loss after 3450 iterations: 0.5446640677773755
Current loss after 3500 iterations: 0.5444785875130921
Current loss after 3550 iterations: 0.5442919975546869
Current loss after 3600 iterations: 0.5441043954568914
Current loss after 3650 iterations: 0.5439158824273329
Current loss after 3700 iterations: 0.5437265632864121
Current loss after 3750 iterations: 0.543536546413723
Current loss after 3800 iterations: 0.5433459436804561
Current loss after 3850 iterations: 0.5431548703670833
Current loss after 3900 iterations: 0.5429634450657731
Current loss after 3950 iterations: 0.5427717895669512
Current loss after 4000 iterations: 0.5425800287295109
Current loss after 4050 iterations: 0.5423882903341672
Current loss after 4100 iterations: 0.542196704919555
Current loss after 4150 iterations: 0.5420054056006957
Current loss after 4200 iterations: 0.5418145278695274
Current loss after 4250 iterations: 0.5416242093773276
Current loss after 4300 iterations: 0.5414345896988662
Current loss after 4350 iterations: 0.541245810078265
Current loss after 4400 iterations: 0.5410580131566342
Current loss after 4450 iterations: 0.5408713426816755
Current loss after 4500 iterations: 0.5406859431995565
Current loss after 4550 iterations: 0.5405019597294717
Current loss after 4600 iterations: 0.5403195374214769
Current loss after 4650 iterations: 0.5401388211983035
Current loss after 4700 iterations: 0.539959955369225
Current loss after 4750 iterations: 0.539783083271969
Current loss after 4800 iterations: 0.5396083468627022
Current loss after 4850 iterations: 0.5394358862859258
Current loss after 4900 iterations: 0.5392658394635707
Current loss after 4950 iterations: 0.5390983416641486
Current loss after 5000 iterations: 0.5389335250655248
Training loss after 5001 iterations: 0.5389335250655248Now we use the optimization result of the first run as the initial condition of the second optimization, and run it with BFGS. This looks like:
optprob2 = OPT.OptimizationProblem(optf, res1.u)
res2 = OPT.solve(
    optprob2, BFGS(linesearch = BackTracking()); callback, maxiters = 1000
)
println("Final training loss after $(length(losses)) iterations: $(losses[end])")

# Rename the best candidate
p_trained = res2.u
ComponentVector{Float64}(layer_1 = (weight = [0.7286599827220712 0.8531671971283472; 0.13245050674355244 -1.0940014533466293; … ; -1.2776547521099282 -1.343156793135805; -2.056839646345303 -1.450636328518308], bias = [0.7153249830502847, -0.37624634387215555, 0.22863767495441928, -0.8118274927901542, -0.7412549258213124]), layer_2 = (weight = [-0.5478717392385324 0.5030164495171459 … 0.6060254290083494 0.3735343023571974; -0.21067233167068206 -0.5242982308803261 … 0.25666582271643357 -0.3519272834171553; … ; -0.6785398269025303 0.19473316951464267 … 0.21494696664798252 -0.3229891389752847; -0.07249632084319224 -0.3483130557397639 … -1.4177873362557927 1.1515208256844516], bias = [0.6391231918041508, 0.903512869668308, -1.1937343730246512, 1.35296139173437, 0.4334519460595456]), layer_3 = (weight = [0.23832673820701716 0.5249256246089532 … 0.5548180061359028 -1.091479604563211; 0.20949900974720284 -0.6771618779748535 … -0.4409635803687165 -0.014220146887849514; … ; -0.14874227029889112 -0.3892578032719391 … 0.0869444027464108 0.2609727653780065; 2.2823929879482243 1.2376301900066704 … -1.6333410532940407 0.23767076666921697], bias = [-0.014588839001058257, -0.12372084322971139, 1.2938078636241062, 0.4340712510497701, -2.486738655157434]), layer_4 = (weight = [-0.013713044921671611 -2.5106715705792135 … 0.008070403590860186 -1.987882039359851; 1.199684766747815 2.265684155918761 … -0.39692142227314786 2.3434937162881218], bias = [-0.10023643040468551, -0.7304944915308698]))and bingo, we have a trained UDE.
Visualizing the Trained UDE
How well did our neural network do? Let's take a look:
# Plot the losses
pl_losses = Plots.Plots.plot(
    1:5000, losses[1:5000], yaxis = :log10, xaxis = :log10,
    xlabel = "Iterations", ylabel = "Loss", label = "ADAM", color = :blue
)
Plots.Plots.plot!(
    5001:length(losses), losses[5001:end], yaxis = :log10, xaxis = :log10,
    xlabel = "Iterations", ylabel = "Loss", label = "BFGS", color = :red
)
Next, we compare the original data to the output of the UDE predictor. Note that we can even create more samples from the underlying model by simply adjusting the time steps!
## Analysis of the trained network
# Plot the data and the approximation
ts = first(solution.t):(Statistics.mean(diff(solution.t)) / 2):last(solution.t)
X̂ = predict(p_trained, Xₙ[:, 1], ts)
# Trained on noisy data vs real solution
pl_trajectory = Plots.Plots.plot(
    ts, transpose(X̂), xlabel = "t", ylabel = "x(t), y(t)", color = :red,
    label = ["UDE Approximation" nothing]
)
Plots.scatter!(solution.t, transpose(Xₙ), color = :black, label = ["Measurements" nothing])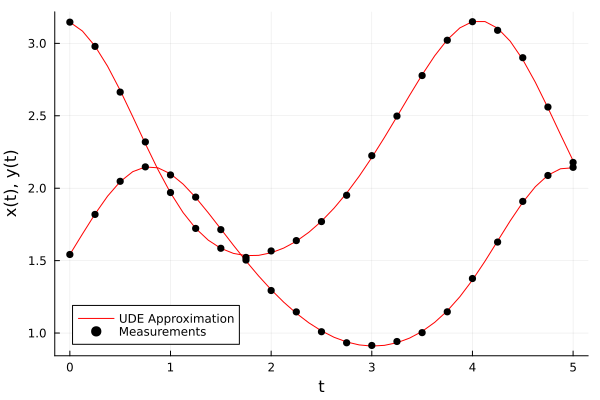
Let's see how well the unknown term has been approximated:
# Ideal unknown interactions of the predictor
Ȳ = [-p_[2] * (X̂[1, :] .* X̂[2, :])'; p_[3] * (X̂[1, :] .* X̂[2, :])']
# Neural network guess
Ŷ = U(X̂, p_trained, st)[1]

pl_reconstruction = Plots.plot(
    ts, transpose(Ŷ), xlabel = "t", ylabel = "U(x,y)", color = :red,
    label = ["UDE Approximation" nothing]
)
Plots.plot!(ts, transpose(Ȳ), color = :black, label = ["True Interaction" nothing])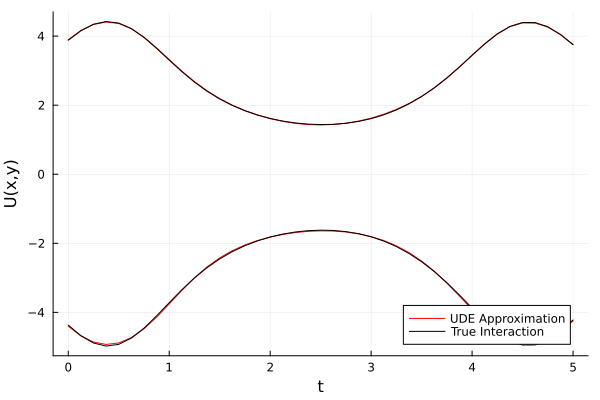
And have a nice look at all the information:
# Plot the error
pl_reconstruction_error = Plots.plot(
    ts, LinearAlgebra.norm.(eachcol(Ȳ - Ŷ)), yaxis = :log, xlabel = "t",
    ylabel = "L2-Error", label = nothing, color = :red
)
pl_missing = Plots.plot(pl_reconstruction, pl_reconstruction_error, layout = (2, 1))

pl_overall = Plots.plot(pl_trajectory, pl_missing)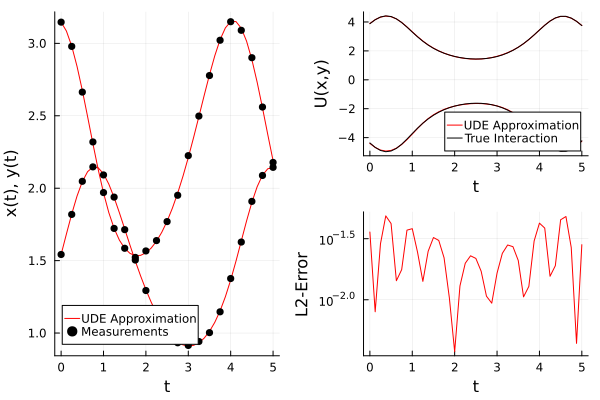
That looks pretty good. And if we are happy with deep learning, we can leave it at that: we have trained a neural network to capture our missing dynamics.
But...
Can we also make it print out the LaTeX for what the missing equations were? Find out more after the break!
Symbolic regression via sparse regression (SINDy based)
This part of the showcase is still a work in progress... shame on us. But be back in a jiffy and we'll have it done.
Okay, that was a quick break, and that's good because this next part is pretty cool. Let's use DataDrivenDiffEq.jl to transform our trained neural network from machine learning mumbo jumbo into predictions of missing mechanistic equations. To do this, we first generate a symbolic basis that represents the space of mechanistic functions we believe this neural network should map to. Let's choose a bunch of polynomial functions:
MTK.@variables u[1:2]
b = DataDrivenDiffEq.polynomial_basis(u, 4)
basis = DataDrivenDiffEq.Basis(b, u);
\[ \begin{align} \mathtt{\varphi{_1}} &= 1 \\ \mathtt{\varphi{_2}} &= u_{1} \\ \mathtt{\varphi{_3}} &= \left( u_{1} \right)^{2} \\ \mathtt{\varphi{_4}} &= \left( u_{1} \right)^{3} \\ \mathtt{\varphi{_5}} &= \left( u_{1} \right)^{4} \\ \mathtt{\varphi{_6}} &= u_{2} \\ \mathtt{\varphi{_7}} &= u_{1} ~ u_{2} \\ \mathtt{\varphi{_8}} &= \left( u_{1} \right)^{2} ~ u_{2} \\ \mathtt{\varphi{_9}} &= \left( u_{1} \right)^{3} ~ u_{2} \\ \mathtt{\varphi{_{1 0}}} &= \left( u_{2} \right)^{2} \\ \mathtt{\varphi{_{1 1}}} &= \left( u_{2} \right)^{2} ~ u_{1} \\ \mathtt{\varphi{_{1 2}}} &= \left( u_{2} \right)^{2} ~ \left( u_{1} \right)^{2} \\ \mathtt{\varphi{_{1 3}}} &= \left( u_{2} \right)^{3} \\ \mathtt{\varphi{_{1 4}}} &= \left( u_{2} \right)^{3} ~ u_{1} \\ \mathtt{\varphi{_{1 5}}} &= \left( u_{2} \right)^{4} \end{align} \]
Now let's define our DataDrivenProblems for the sparse regressions. To assess the capability of the sparse regression, we will look at 3 cases:
- What if we trained no neural network and tried to automatically uncover the equations from the original noisy data? This is the approach in the literature known as structural identification of dynamical systems (SINDy). We will call this the full problem. This will assess whether this incorporation of prior information was helpful.
- What if we trained the neural network using the ideal right-hand side missing derivative functions? This is the value computed in the plots above as
Ȳ. This will tell us whether the symbolic discovery could work in ideal situations. - Do the symbolic regression directly on the function
y = NN(x), i.e. the trained learned neural network. This is what we really want, and will tell us how to extend our known equations.
To define the full problem, we need to define a DataDrivenProblem that has the time series of the solution X, the time points of the solution t, and the derivative at each time point of the solution, obtained by the ODE solution's interpolation. We can just use an interpolation to get the derivative:
full_problem = DataDrivenDiffEq.ContinuousDataDrivenProblem(Xₙ, t)Continuous DataDrivenProblem{Float64} ##DDProblem#2796 in 2 dimensions and 21 samplesNow for the other two symbolic regressions, we are regressing input/outputs of the missing terms, and thus we directly define the datasets as the input/output mappings like:
ideal_problem = DataDrivenDiffEq.DirectDataDrivenProblem(X̂, Ȳ)
nn_problem = DataDrivenDiffEq.DirectDataDrivenProblem(X̂, Ŷ)
Direct DataDrivenProblem{Float64} ##DDProblem#2798 in 2 dimensions and 41 samplesLet's solve the data-driven problems using sparse regression. We will use the ADMM method, which requires we define a set of shrinking cutoff values λ, and we do this like:
λ = 0.1
opt = ADMM(λ)
DataDrivenSparse.ADMM{Float64, Float64}(0.1, 1.0)This is one of many methods for sparse regression, consult the DataDrivenDiffEq.jl documentation for more information on the algorithm choices. Taking this, let's solve each of the sparse regressions:
options = DataDrivenDiffEq.DataDrivenCommonOptions(
    maxiters = 10_000,
    normalize = DataDrivenDiffEq.DataNormalization(DataDrivenDiffEq.ZScoreTransform),
    selector = DataDrivenDiffEq.bic, digits = 1,
    data_processing = DataDrivenDiffEq.DataProcessing(
        split = 0.9,
        batchsize = 30,
        shuffle = true,
        rng = StableRNGs.StableRNG(1111)
    )
)

full_res = DataDrivenDiffEq.solve(full_problem, basis, opt; options)
full_eqs = DataDrivenDiffEq.get_basis(full_res)
println(full_res)
┌ Warning: Number of observations less than batch-size, decreasing the batch-size to 19
└ @ MLUtils ~/.julia/packages/MLUtils/QLTsU/src/batchview.jl:104
"DataDrivenSolution{Float64}" with 2 equations and 4 parameters.
Returncode: Success
Residual sum of squares: 84.99147506548836options = DataDrivenDiffEq.DataDrivenCommonOptions(
maxiters = 10_000,
normalize = DataDrivenDiffEq.DataNormalization(DataDrivenDiffEq.ZScoreTransform),
selector = DataDrivenDiffEq.bic, digits = 1,
data_processing = DataDrivenDiffEq.DataProcessing(
split = 0.9,
batchsize = 30,
shuffle = true,
rng = StableRNGs.StableRNG(1111)
)
)
ideal_res = DataDrivenDiffEq.solve(ideal_problem, basis, opt; options)
ideal_eqs = DataDrivenDiffEq.get_basis(ideal_res)
println(ideal_res)"DataDrivenSolution{Float64}" with 2 equations and 2 parameters.
Returncode: Success
Residual sum of squares: 12.267214082919892options = DataDrivenDiffEq.DataDrivenCommonOptions(
maxiters = 10_000,
normalize = DataDrivenDiffEq.DataNormalization(DataDrivenDiffEq.ZScoreTransform),
selector = DataDrivenDiffEq.bic, digits = 1,
data_processing = DataDrivenDiffEq.DataProcessing(
split = 0.9,
batchsize = 30,
shuffle = true,
rng = StableRNGs.StableRNG(1111)
)
)
nn_res = DataDrivenDiffEq.solve(nn_problem, basis, opt; options)
nn_eqs = DataDrivenDiffEq.get_basis(nn_res)
println(nn_res)"DataDrivenSolution{Float64}" with 2 equations and 2 parameters.
Returncode: Success
Residual sum of squares: 12.251386605548548Note that we passed the identical options into each of the solve calls to get the same data for each call.
We already saw that the full problem has failed to identify the correct equations of motion. To have a closer look, we can inspect the corresponding equations:
for eqs in (full_eqs, ideal_eqs, nn_eqs)
    println(eqs)
    println(DataDrivenDiffEq.get_parameter_map(eqs))
    println()
end
Model ##Basis#2799 with 2 equations
States : u[1] u[2]
Parameters : p₁ p₂ p₃ p₄
Independent variable: t
Equations
Differential(t, 1)(u[1]) = p₁*u[1] + p₂*u[2] + p₃*(u[2]^2)
Differential(t, 1)(u[2]) = p₄*u[2]
Pair{SymbolicUtils.BasicSymbolicImpl.var"typeof(BasicSymbolicImpl)"{SymbolicUtils.SymReal}, Float64}[p₁ => 0.8, p₂ => -0.2, p₃ => -0.4, p₄ => -0.9]
Model ##Basis#2803 with 2 equations
States : u[1] u[2]
Parameters : p₁ p₂
Independent variable: t
Equations
φ₁ = p₁*u[1]*u[2]
φ₂ = p₂*u[1]*u[2]
Pair{SymbolicUtils.BasicSymbolicImpl.var"typeof(BasicSymbolicImpl)"{SymbolicUtils.SymReal}, Float64}[p₁ => -0.8, p₂ => 0.7]
Model ##Basis#2807 with 2 equations
States : u[1] u[2]
Parameters : p₁ p₂
Independent variable: t
Equations
φ₁ = p₁*u[1]*u[2]
φ₂ = p₂*u[1]*u[2]
Pair{SymbolicUtils.BasicSymbolicImpl.var"typeof(BasicSymbolicImpl)"{SymbolicUtils.SymReal}, Float64}[p₁ => -0.8, p₂ => 0.7]Next, we want to predict with our model. To do so, we embed the basis into a function like before:
# Define the recovered, hybrid model
function recovered_dynamics!(du, u, p, t)
    û = nn_eqs(u, p) # Recovered equations
    du[1] = p_[1] * u[1] + û[1]
    du[2] = -p_[4] * u[2] + û[2]
    return
end

estimation_prob = ODE.ODEProblem(recovered_dynamics!, u0, tspan, DataDrivenDiffEq.get_parameter_values(nn_eqs))
estimate = ODE.solve(estimation_prob, ODE.Tsit5(), saveat = solution.t)

# Plot
Plots.plot(solution)
Plots.plot!(estimate)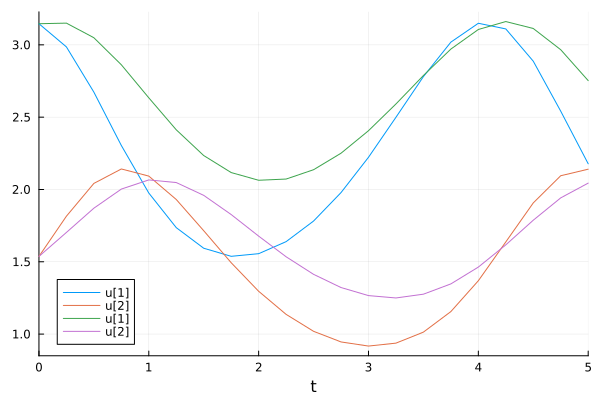
We are still a bit off, so we fine tune the parameters by simply minimizing the residuals between the UDE predictor and our recovered parametrized equations:
function parameter_loss(p)
    Y = reduce(hcat, map(Base.Fix2(nn_eqs, p), eachcol(X̂)))
    return sum(abs2, Ŷ .- Y)
end

optf = OPT.OptimizationFunction((x, p) -> parameter_loss(x), adtype)
optprob = OPT.OptimizationProblem(optf, DataDrivenDiffEq.get_parameter_values(nn_eqs))
parameter_res = OPT.solve(optprob, LBFGS(), maxiters = 1000)
retcode: Success
u: 2-element Vector{Float64}:
-0.8993102840610786
0.8003201531054469Simulation
# Look at long term prediction
t_long = (0.0, 50.0)
estimation_prob = ODE.ODEProblem(recovered_dynamics!, u0, t_long, parameter_res)
estimate_long = ODE.solve(estimation_prob, ODE.Tsit5(), saveat = 0.1) # Using higher tolerances here results in exit of julia
Plots.plot(estimate_long)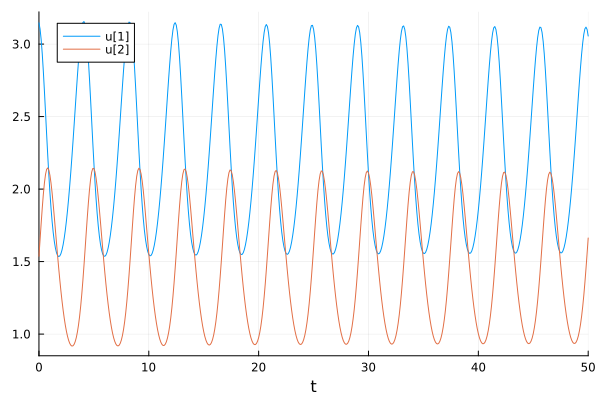
true_prob = ODE.ODEProblem(lotka!, u0, t_long, p_)
true_solution_long = ODE.solve(true_prob, ODE.Tsit5(), saveat = estimate_long.t)
Plots.plot!(true_solution_long)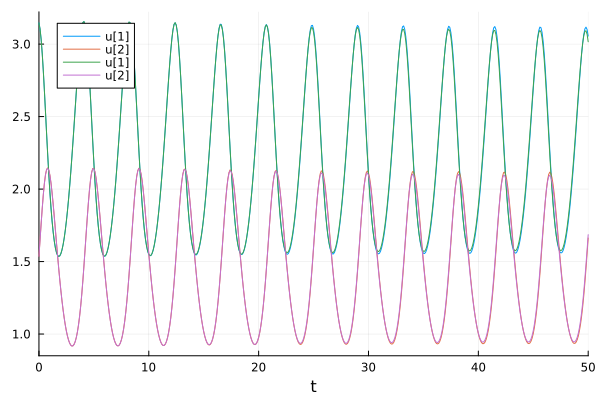
Post Processing and Plots
c1 = 3 # RGBA(174/255,192/255,201/255,1) # Maroon
c2 = :orange # RGBA(132/255,159/255,173/255,1) # Red
c3 = :blue # RGBA(255/255,90/255,0,1) # Orange
c4 = :purple # RGBA(153/255,50/255,204/255,1) # Purple

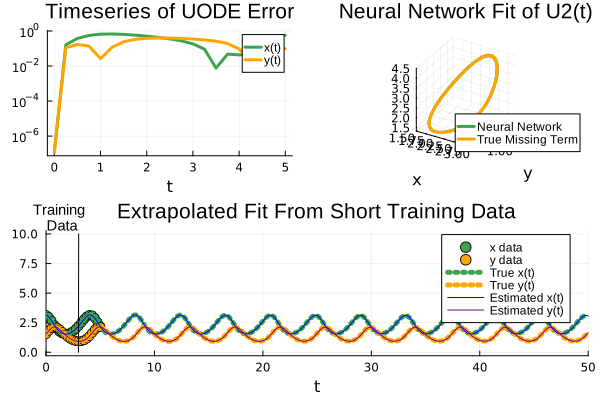
p1 = Plots.plot(
    t, abs.(Array(solution) .- estimate)' .+ eps(Float32),
    lw = 3, yaxis = :log, title = "Timeseries of UODE Error",
    color = [3 :orange], xlabel = "t",
    label = ["x(t)" "y(t)"],
    titlefont = "Helvetica", legendfont = "Helvetica",
    legend = :topright
)

# Plot L₂
p2 = Plots.plot3d(
    X̂[1, :], X̂[2, :], Ŷ[2, :], lw = 3,
    title = "Neural Network Fit of U2(t)", color = c1,
    label = "Neural Network", xaxis = "x", yaxis = "y",
    titlefont = "Helvetica", legendfont = "Helvetica",
    legend = :bottomright
)
Plots.plot!(X̂[1, :], X̂[2, :], Ȳ[2, :], lw = 3, label = "True Missing Term", color = c2)

p3 = Plots.scatter(
    solution, color = [c1 c2], label = ["x data" "y data"],
    title = "Extrapolated Fit From Short Training Data",
    titlefont = "Helvetica", legendfont = "Helvetica",
    markersize = 5
)

Plots.plot!(
    p3, true_solution_long, color = [c1 c2], linestyle = :dot, lw = 5,
    label = ["True x(t)" "True y(t)"]
)
Plots.plot!(
    p3, estimate_long, color = [c3 c4], lw = 1,
    label = ["Estimated x(t)" "Estimated y(t)"]
)
Plots.plot!(p3, [2.99, 3.01], [0.0, 10.0], lw = 1, color = :black, label = nothing)
Plots.annotate!([(1.5, 13, Plots.text("Training \nData", 10, :center, :top, :black, "Helvetica"))])
l = Plots.@layout [
    Plots.grid(1, 2)
    Plots.grid(1, 1)
]
Plots.plot(p1, p2, p3, layout = l)